Exmouth median property price tripled over last 25 years, data shows
By Will Goddard 12th Jul 2023
")

The median price paid for a residential property in Exmouth has tripled over the past 25 years even after adjusting for inflation, according to Office for National Statistics data.
The median Exmouth property cost £99k in 1997 compared with £315k in December 2022, a rise of 318 per cent.
The 1997 price was actually £57k, but adjusting for inflation to get its cost if it were sold in 2022 brings it up to £99k.
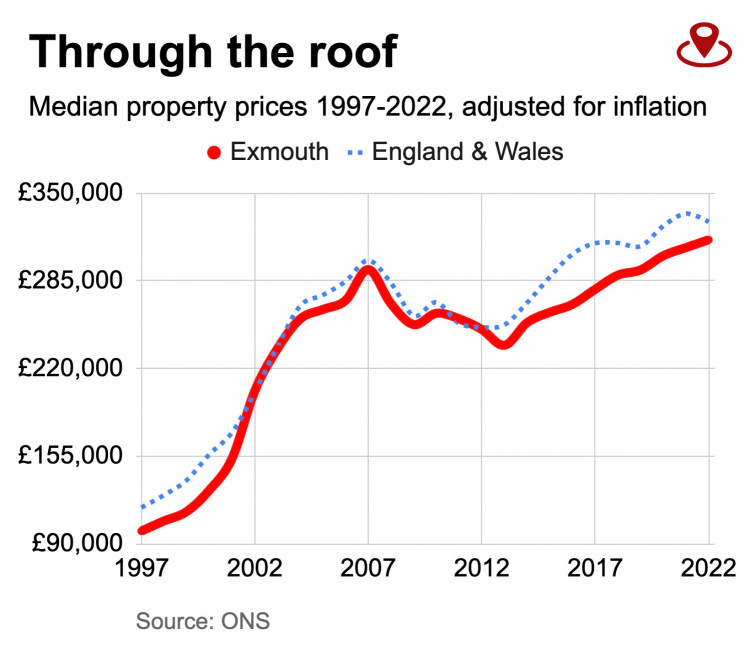
Exmouth has consistently been below the England and Wales median property price, however.
The data shows a steep rise between 2000 and 2007, then a dip from 2008 to 2013, followed by a steady climb.
This broadly reflects the early-2000s national housing bubble, in which there was a growing population, fewer homes being built and a rising supply of mortgages.
The bubble burst when the UK property market crashed in the 2008 recession, after which it steadily recovered. It took another, smaller hit in the Covid-19 pandemic.
Click here to see the ONS data. We adjusted for inflation using the ONS CPI index.
CHECK OUT OUR Jobs Section HERE!
exmouth vacancies updated hourly!
Click here to see more: exmouth jobs
Share: